概述
Prometheus是一个监控服务器,也是一个时序数据库TSDB,由Go语言编写。主要用于监控容器数据,也可以监控常规主机。Prometheus有专门的PQL,即Prometheus查询语言。它采用Pull方式获取监控数据,可以与其他组件完美结合
Grafana主要用于大规模指标数据的可视化展现,是网络架构和应用分析中最流行的时序数据展示工具。Grafana可以与多个数据源连接,每个数据源都有一个特定的查询编辑器,该编辑器定制的特性和功能是公开的特定数据来源。官方支持的数据源有Graphite、Elasticsearch、InfluxDB、Prometheus、Cloudwatch、MySQL和OpenTSDB等2。
这段时间在写网关项目,而网关项目最少不了的除却日志系统,还有监控系统,因此有了这篇博文。不过并未涉及更深层次的运用。故如标题所说只是简单使用。
另外,如果是 SpringBoot 无需参照本文,直接使用其提供的 starter 即可。
依赖项安装
Prometheus: https://prometheus.io/download/
Grafana: https://grafana.com/grafana/download
Maven
客户端如果想接入 Prometheus 需要三个包,如下:
- micrometer-registry-prometheus
- simpleclient_hotspot
- micrometer-core
有趣的是网上大多文章只提供第一个依赖便可以使用,可能是版本差异导致。另外,如果项目是使用 SpringBoot 开发则无需这么复杂,可以直接使用 SpringBoot 提供的包。
    <dependency>
        <groupId>io.micrometer</groupId>
        <artifactId>micrometer-registry-prometheus</artifactId>
        <version>1.11.3</version>
    </dependency>
    <dependency>
        <groupId>io.prometheus</groupId>
        <artifactId>simpleclient_hotspot</artifactId>
        <version>0.16.0</version>
    </dependency>
    <dependency>
        <groupId>io.micrometer</groupId>
        <artifactId>micrometer-core</artifactId>
        <version>1.11.0</version>
    </dependency>
开始
对于监控系统的接入而言,很简单的逻辑就是:在事件发生前开始记录,在事件发生后开始收尾。
如果监控系统基于push模式去获取监控信息,那么显然是需要在事件发生后的收尾中将监控信息push到监控系统。期间的坏处也显然,如果接入监控系统的服务很多,一直push可能给监控系统搞得宕机。如果监控系统需要跟服务去通知自身的负载能力呢?复杂度又上了一层。
所以可以理解在概述中对 Prometheus 的描述:“它采用Pull方式获取监控数据”。将是否获取信息的选择权交给了监控系统本身。
事件何时触发?
在我所写的网关项目中,每一个请求都要经过一个过滤器链条,很显然所谓事件发生前应该在过滤器链条的收尾。
/**
* @version V1.0
* @auhter 枯木
* @desc 服务信息监控拦截器
* @date 2023/09/02/21:55
*/
@FilterAspect(id = MONITOR_FILTER_ID,
        name = MONITOR_FILTER_NAME, order = MONITOR_FILTER_ORDER)
public class MonitorFilter implements Filter {
    @Override
    public void doFilter(GatewayContext ctx) throws Exception {
        // 初始化监控器
        ctx.setTimerSample(Timer.start());
    }
}
其中最主要的是通过 Timer.start() 去创建一个计时器,基于它可以在系统内部定时进行采样,并将其设置到整体的上下文之中。
事件何时结束?如何上传
自然是过滤器的尾部。在时间结束的时候通过注册器 prometheusMeterRegistry 去设置一些上传相关的数据,再由直接设置的timer的stop方法将两者产生关联,此时timer的流程就结束了,其内部会暂存在此期间产生的数据,等待监控系统那个主动去拉取。对于注册器的初始化由下一个段落负责。
@Override
public void doFilter(GatewayContext ctx) throws Exception {

    // 要上传的信息
    Timer timer = prometheusMeterRegistry.timer(
            "gateway_request",
            "serverName", ctx.getTargetServiceName(),
            "protocol", ctx.getProtocol(),
            "path", ctx.getRequest().getPath()
    );

    ctx.getTimerSample().stop(timer);
}
完整的代码
/**
* @version V1.0
* @auhter 枯木
* @desc 服务信息上传拦截器
* @date 2023/09/02/21:55
*/
@Slf4j
@FilterAspect(id = MONITOR_END_FILTER_ID,
        name = MONITOR_END_FILTER_NAME, order = MONITOR_END_FILTER_ORDER)
public class MonitorEndFilter implements Filter {

    private final PrometheusMeterRegistry prometheusMeterRegistry;

    public MonitorEndFilter() {
        this.prometheusMeterRegistry = new PrometheusMeterRegistry(PrometheusConfig.DEFAULT);
    }

    @Override
    public void doFilter(GatewayContext ctx) throws Exception {

        // 要上传的信息
        Timer timer = prometheusMeterRegistry.timer(
                "gateway_request",
                "serverName", ctx.getTargetServiceName(),
                "protocol", ctx.getProtocol(),
                "path", ctx.getRequest().getPath()
        );

        ctx.getTimerSample().stop(timer);
    }
}
Registry的初始化与注册HTTP服务提供监控信息
对于 PrometheusMeterRegistry 的初始化,一般可以直接通过以下代码获得一个默认的实现。
    public MonitorEndFilter() {
        this.prometheusMeterRegistry = new PrometheusMeterRegistry(PrometheusConfig.DEFAULT);
    }
但在构造函数中其实不仅只有以上一句赋值。因为监控系统使用的是Poll的形式去获取监控信息,所以必须要提供一个HTTP服务去返回当前存储的监控信息,因此通过原生的 HttpServer.create() 方式去创建了一个HTTP Server,运行在配置类制定的端口下。
有如下代码:
public MonitorEndFilter() {
    this.prometheusMeterRegistry = new PrometheusMeterRegistry(PrometheusConfig.DEFAULT);
    int prometheusPort = ConfigLoader.getConfig().getPrometheusPort();
    try {
        //当该类初始化后, 注册一个单独的server, 为普罗米修斯监控平台提供当前留存的信息
        HttpServer server = HttpServer.create(new InetSocketAddress(prometheusPort), 0);
        server.createContext("/prometheus", exchange -> {
            String scrape = prometheusMeterRegistry.scrape();
            // 将存储的信息返回
            exchange.sendResponseHeaders(200, scrape.getBytes().length);
            try (OutputStream os = exchange.getResponseBody()) {
                os.write(scrape.getBytes(StandardCharsets.UTF_8));
            }
        });

        Thread thread = new Thread(server::start);
        thread.setName("prometheusHttpServerThread");
        thread.start();

    } catch (Exception e) {
        log.error("prometheus http server start error", e);
        throw new RuntimeException(e);
    }
    log.info("prometheus http server start successful, port:{}", prometheusPort);
}
其中主要依赖于 prometheusMeterRegistry.scrape() 方法获取目前的监控信息。
此后为了方便后续图标的展示,通过模拟的方式增加数据。
Executors.newScheduledThreadPool(1000).scheduleAtFixedRate(() -> {
    Timer.Sample sample = Timer.start();
    try {
        Thread.sleep(RandomUtil.randomInt(100));
        Timer timer = prometheusMeterRegistry.timer(
                "gateway_request",
                "serverName", "http-server",
                "protocol", "http",
                "path", "/http-server/ping" + RandomUtil.randomInt(10)
        );
        sample.stop(timer);

    } catch (InterruptedException e) {
        e.printStackTrace();
    }
}, 200, 100, TimeUnit.MILLISECONDS);
此后如果访问配置类端口下的路径 “/prometheus” 可以获得以下数据(其中数据做了一定减少):
# HELP gateway_request_seconds
# TYPE gateway_request_seconds summary
gateway_request_seconds_count{path="/http-server/ping5",protocol="http",serverName="http-server",} 423.0
gateway_request_seconds_sum{path="/http-server/ping5",protocol="http",serverName="http-server",} 21.4344979
# HELP gateway_request_seconds_max
# TYPE gateway_request_seconds_max gauge
gateway_request_seconds_max{path="/http-server/ping4",protocol="http",serverName="http-server",} 0.097694
gateway_request_seconds_max{path="/test/ping",protocol="http",serverName="test",} 0.0
gateway_request_seconds_max{path="/http-server/ping9",protocol="http",serverName="http-server",} 0.099713
自此,在服务端的任务就此结束。
Prometheus客户端启动
主要先要将前述所编写的HTTP服务的地址配置到根目录下的 prometheus.yml 之中
    config.
    # 你所设置的HTTP服务地址
    metrics_path: "/prometheus"
    static_configs:
        # 你所设置的HTTP服务
        - targets: ["localhost:18000"]
其后点击Prometheus.exe(Windows环境下)运行,其Web管理页面默认运行在9090,默认账号和密码为admin。
其后可以在菜单栏 Status -> Targets 中查看该HTTP服务的状态。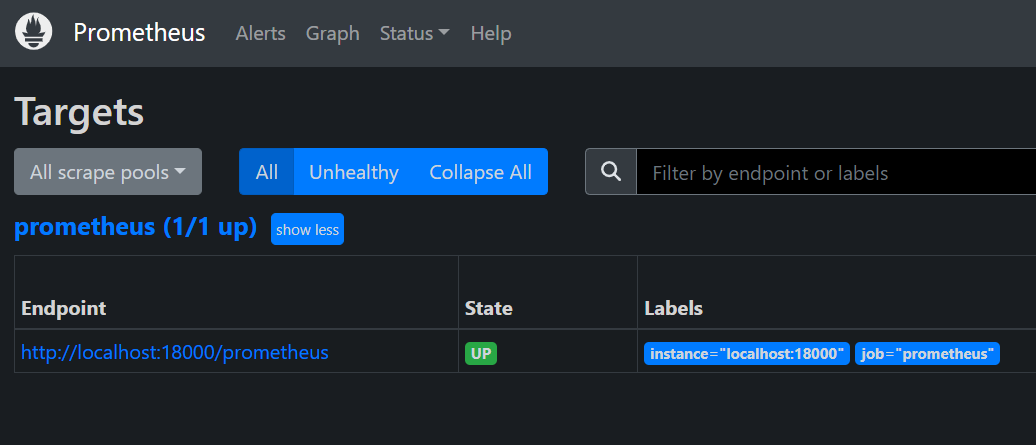
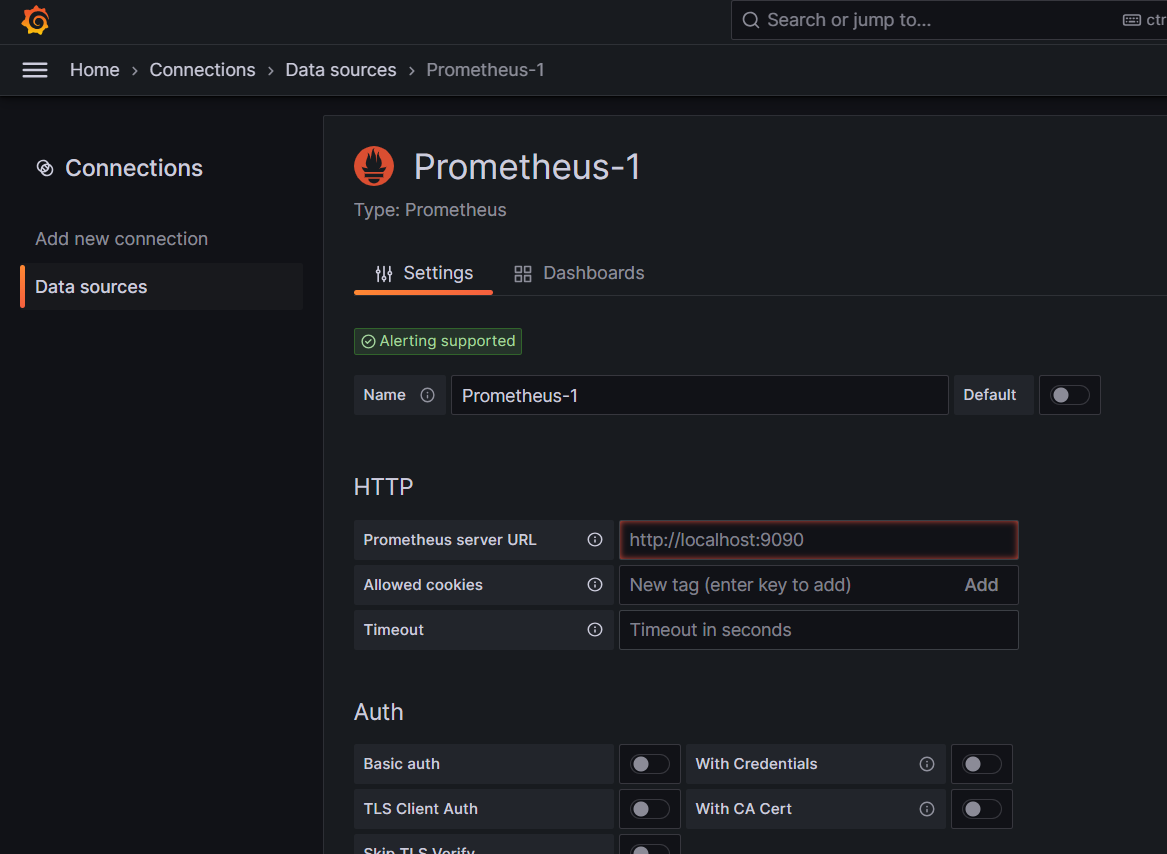
将信息注册到Grafana中
Grafana主要是一个数据渲染系统,首先要将Prometheus以数据源的方式注册进去。
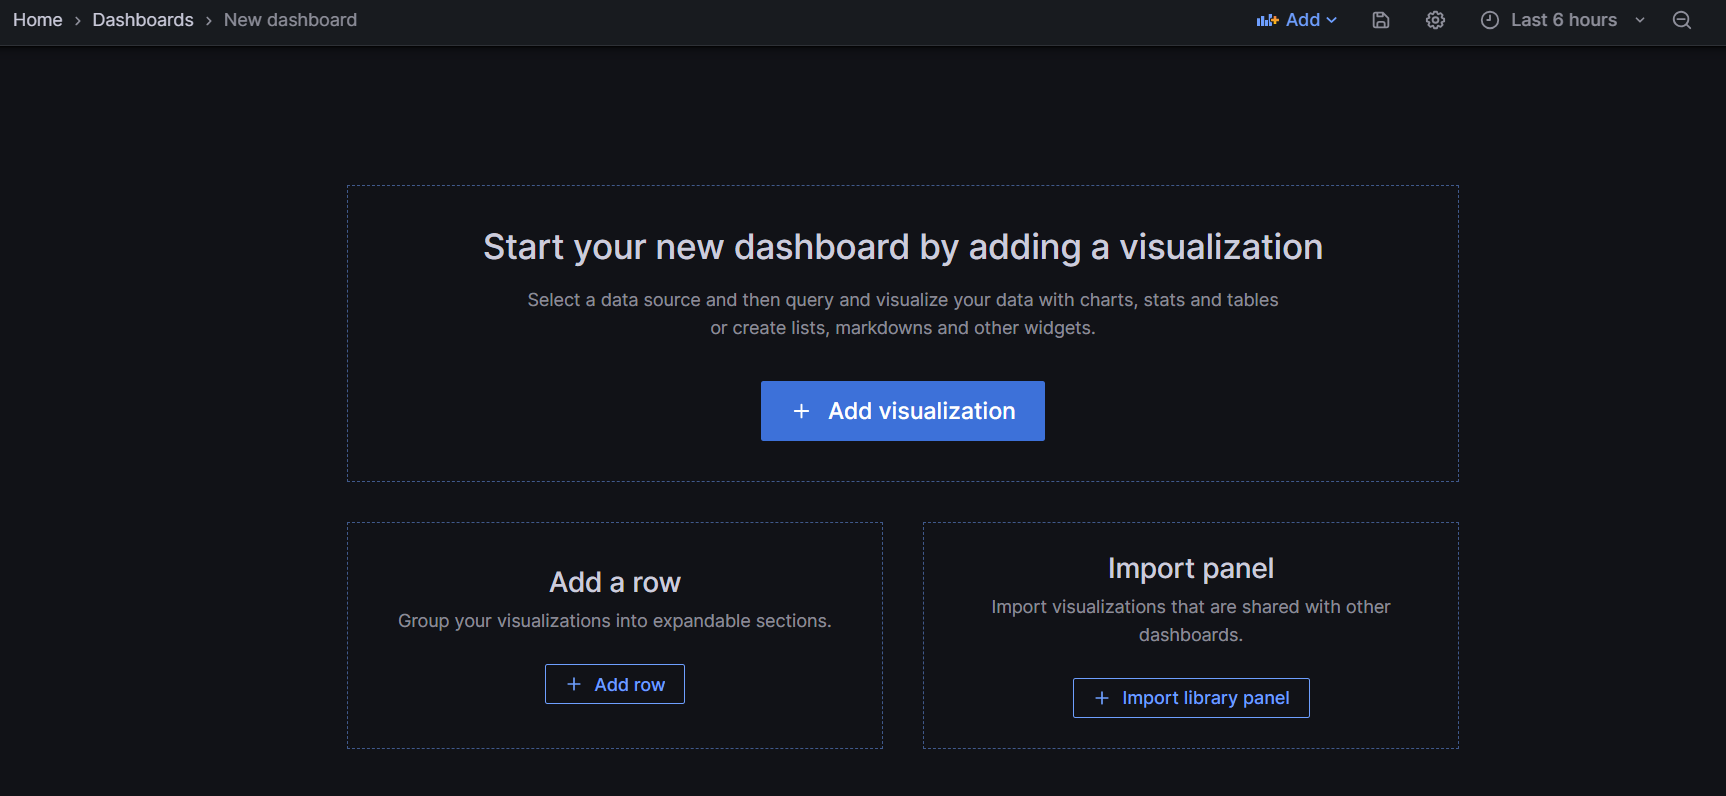
然后就可以在此基础上创建图标,
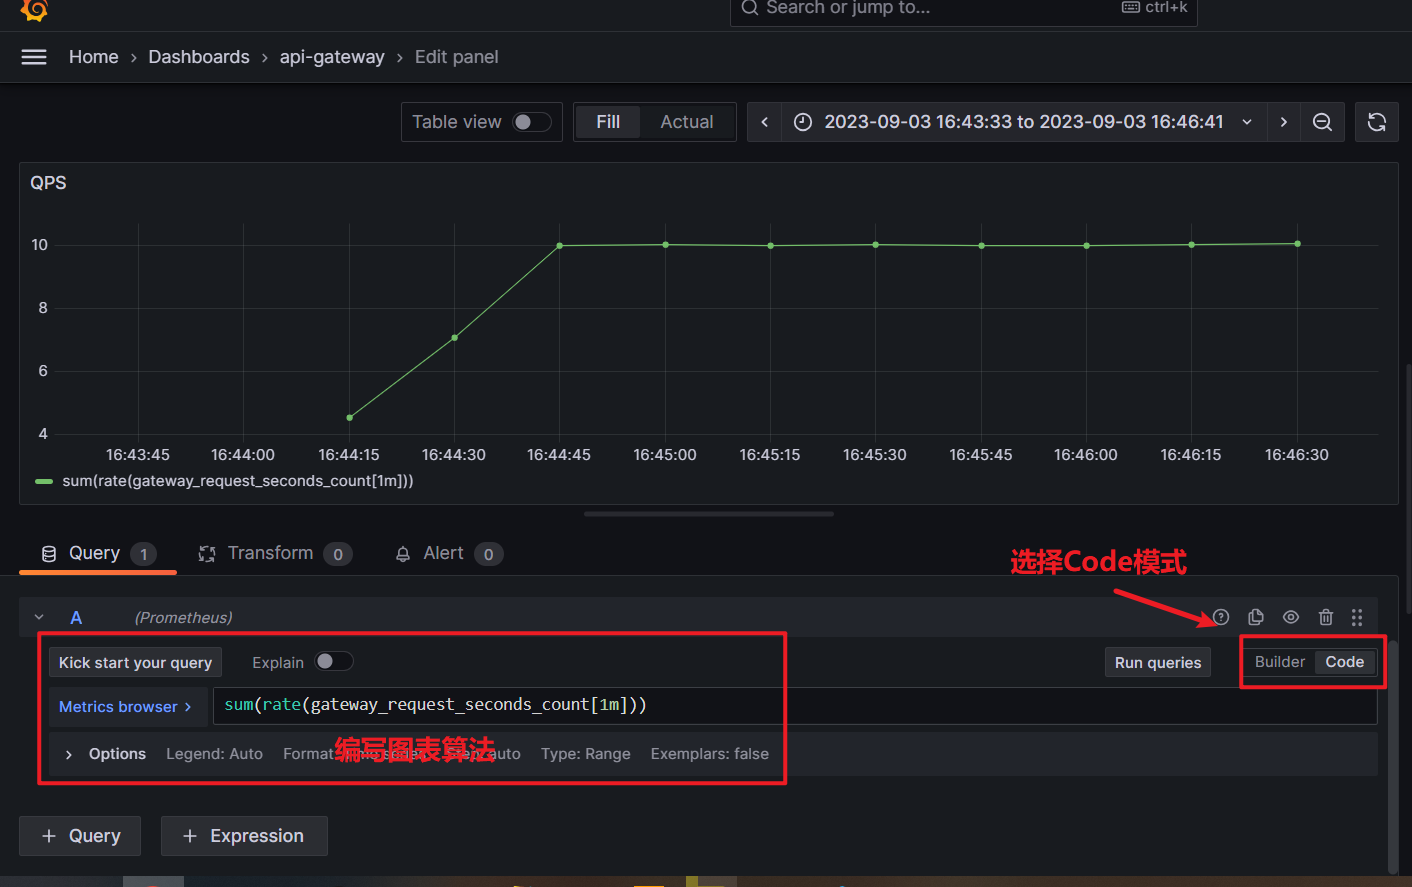
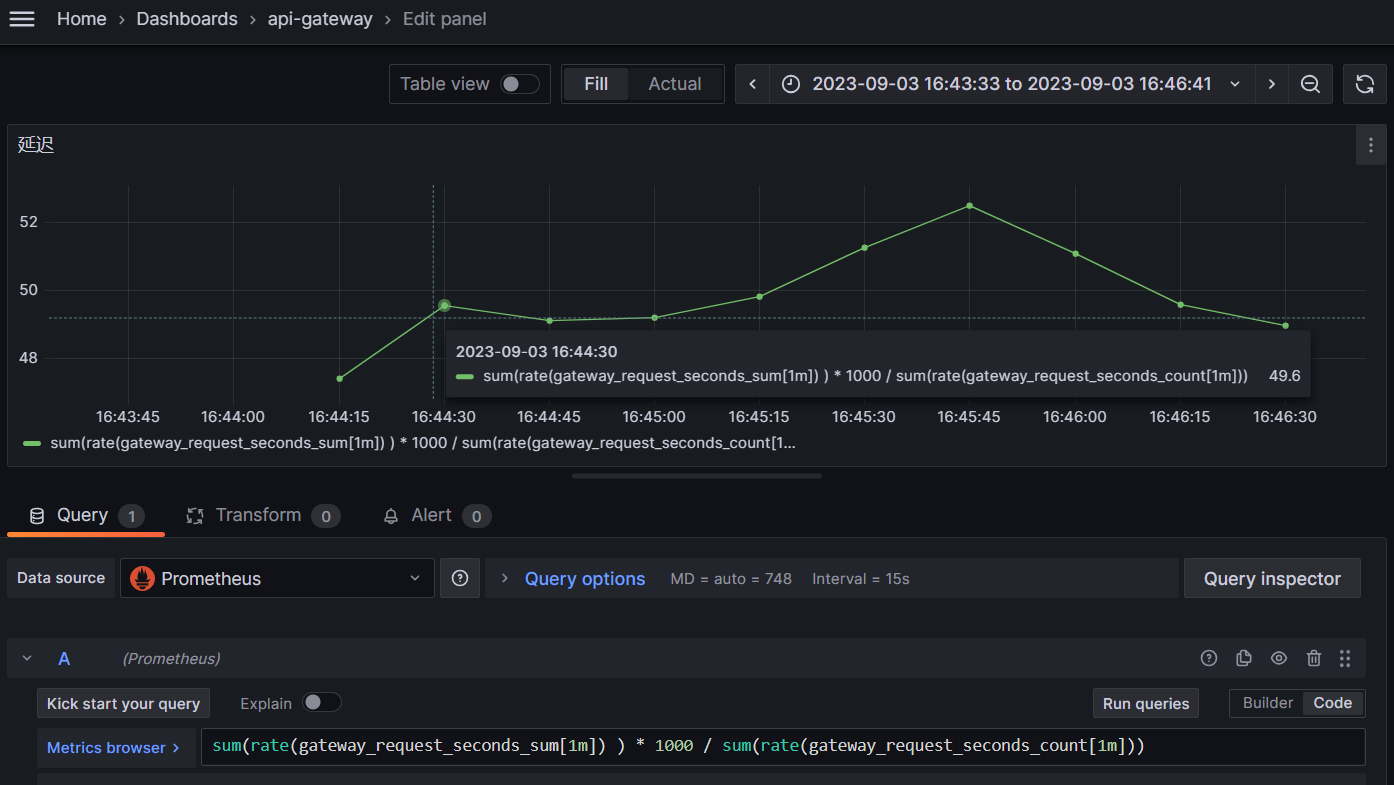
自此就可以根据数据源去执行一定的指令,借以显示图表。如下图的 “sum(rate(gateway_request_seconds_count[1m]))”, 先用 rate 函数求出了每个请求所需要消耗的平均时间,又用 sum 将所有路径的请求做了汇总,以此计算系统在每个时间段消耗了多长时间在处理这些请求。(点击 Run queries 查看效果)
又有下图的计算每个请求的平均时间延迟。
自此结束。
最后
其实本篇博文除却记录本身意义,其实深深地感觉并没有什么意思,也尚未深入的学习研究某个事物,不过是觉得这些时候忘记了记录自己所学的东西,显得有些颓废,又觉因为这一年多很少去写一些文字的缘故导致需要记录的时候却无从下手,急需再写些什么以练习... 之前本打算好好去写一篇博文记录暑期做了些什么,不过最终没有落实。
hallo
KuM 2023-09-03